New York, March 25, 2014 – Data through January 2014, released today by S&P Dow Jones Indices for its S&P/Case-Shiller1 Home Price Indices, the leading measure of U.S. home prices, showed that the 10-City and 20-City Composites rose 13.5% and 13.2% year-over-year. Twelve cities and the 20-City Composite saw their annual rates worsen.
The 10-City Composite showed a slight uptick in its index level but remained relatively unchanged. The 20-City Composite, a broader measure of home prices, posted its third consecutive monthly decline of 0.1%. Twelve cities declined in January with Chicago decreasing 1.2%. Las Vegas led at +1.1% and posted its 22nd consecutive monthly gain. Despite recent advances, Las Vegas is still the farthest from its high set in August 2006 with a peak-to-current decline of 45%. Dallas and Denver are now less than 1% away from their recent all-time index highs.
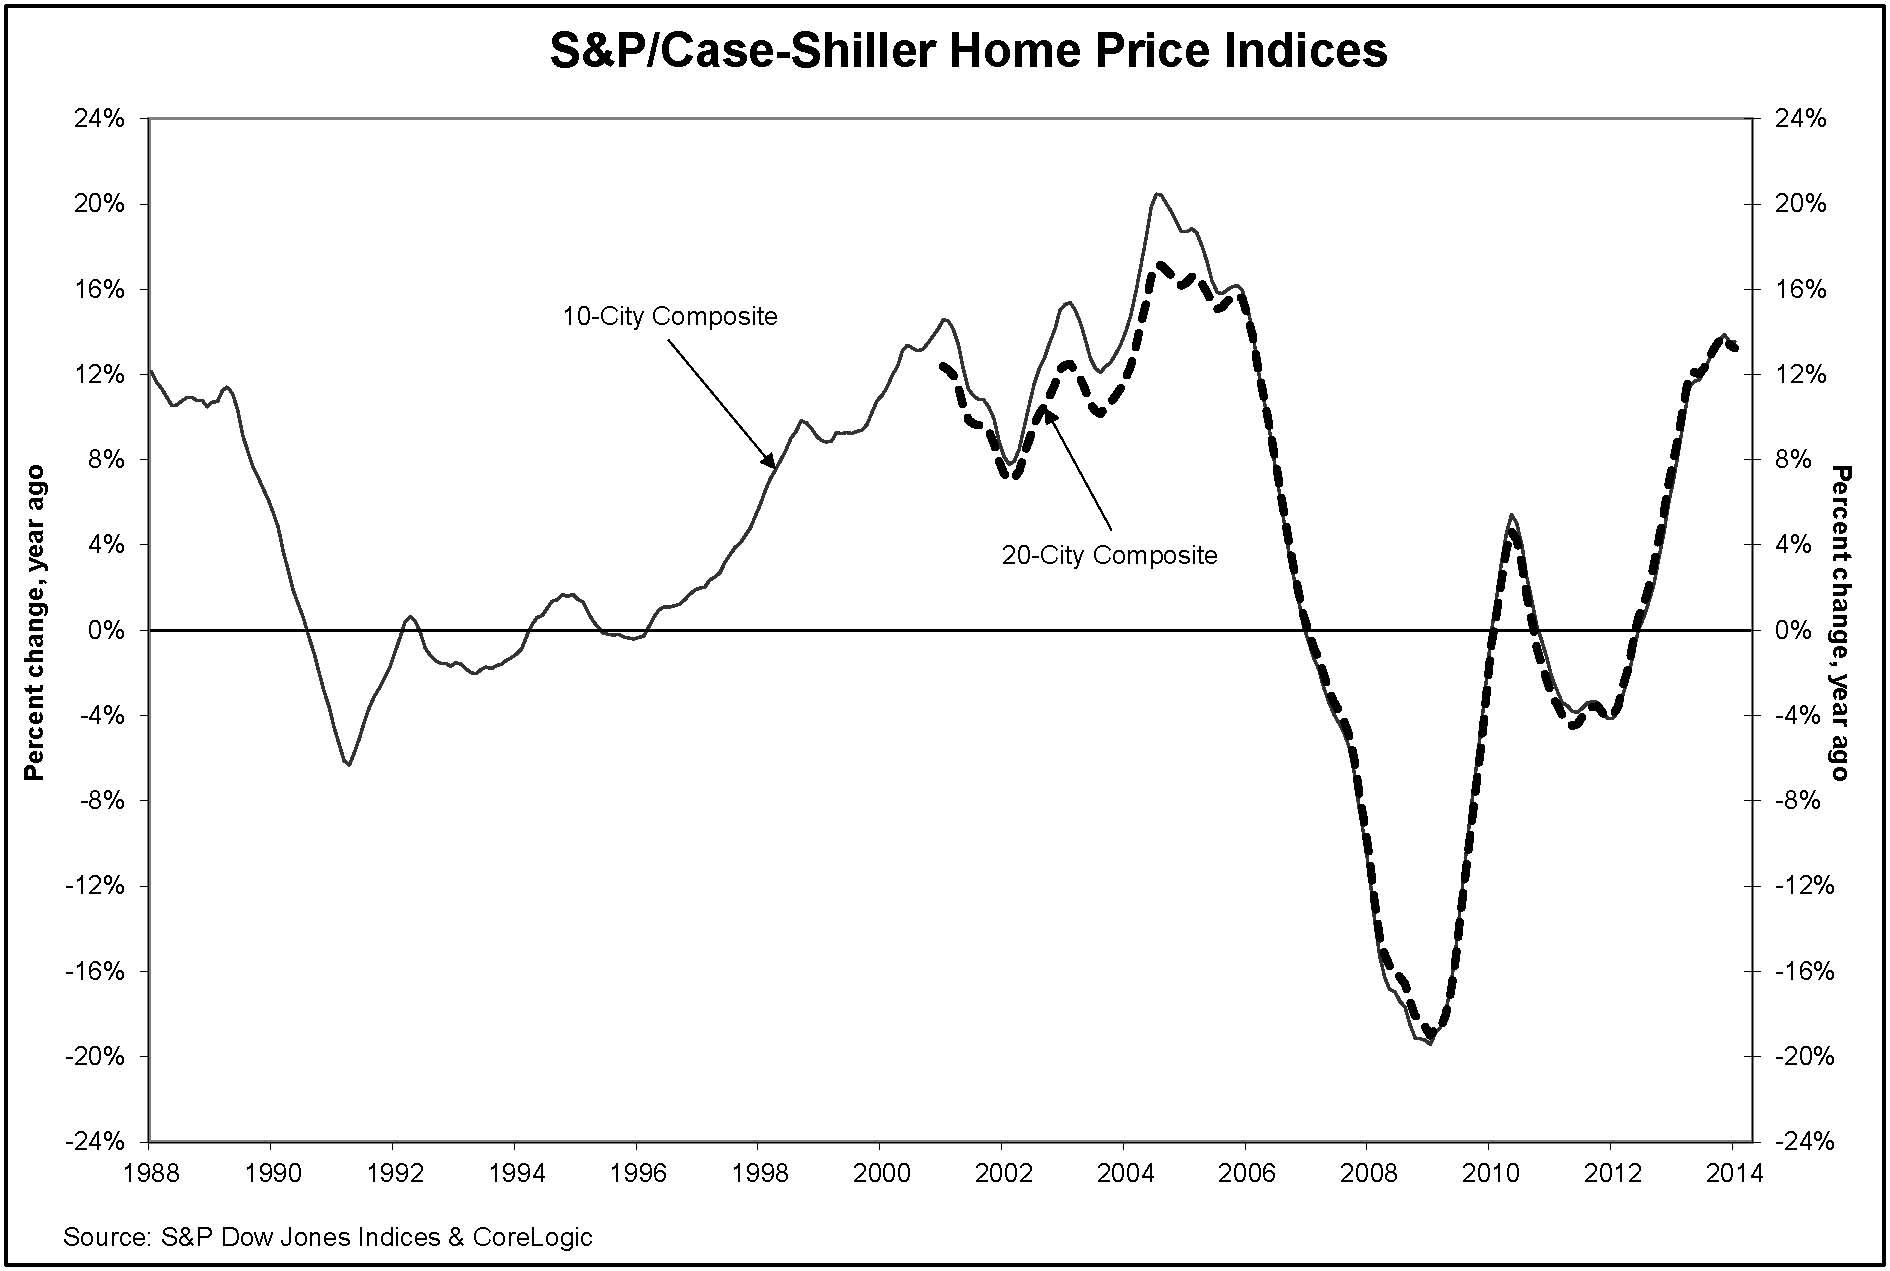
The chart above depicts the 10-City Composite and the 20-City Composite Home Price Indices. In January 2014, the 10-City and 20-City Composites posted year-over-year increases of 13.5% and 13.2%.
“The housing recovery may have taken a breather due to the cold weather,” says David M. Blitzer, Chairman of the Index Committee at S&P Dow Jones Indices. “Twelve cities reported declining prices in January vs. December; eight of those were worse than the month before. From the bottom in 2012, prices are up 23% and the housing market is showing signs of moving forward with more normal price increases.
“The Sun Belt showed the five highest monthly returns. Las Vegas was the leader with an increase of 1.1% followed by Miami at +0.7%. San Diego showed its best January performance of 0.6% since 2004. San Francisco and Tampa trailed closely at +0.5% and +0.4%. Elsewhere, New York and Washington D.C. stood out as they continued to improve and posted their highest year-over-year returns since 2006. Dallas and Denver are the only cities to have reached new record peaks while Detroit remains the only city with home prices below those of 14 years ago.
“Expectations and recent data point to continued home price gains for 2014. Although most analysts do not expect the same rapid increases we saw last year, the consensus is for moderating gains. Existing home sales declined slightly in February and are at their lowest level since July 2012.”
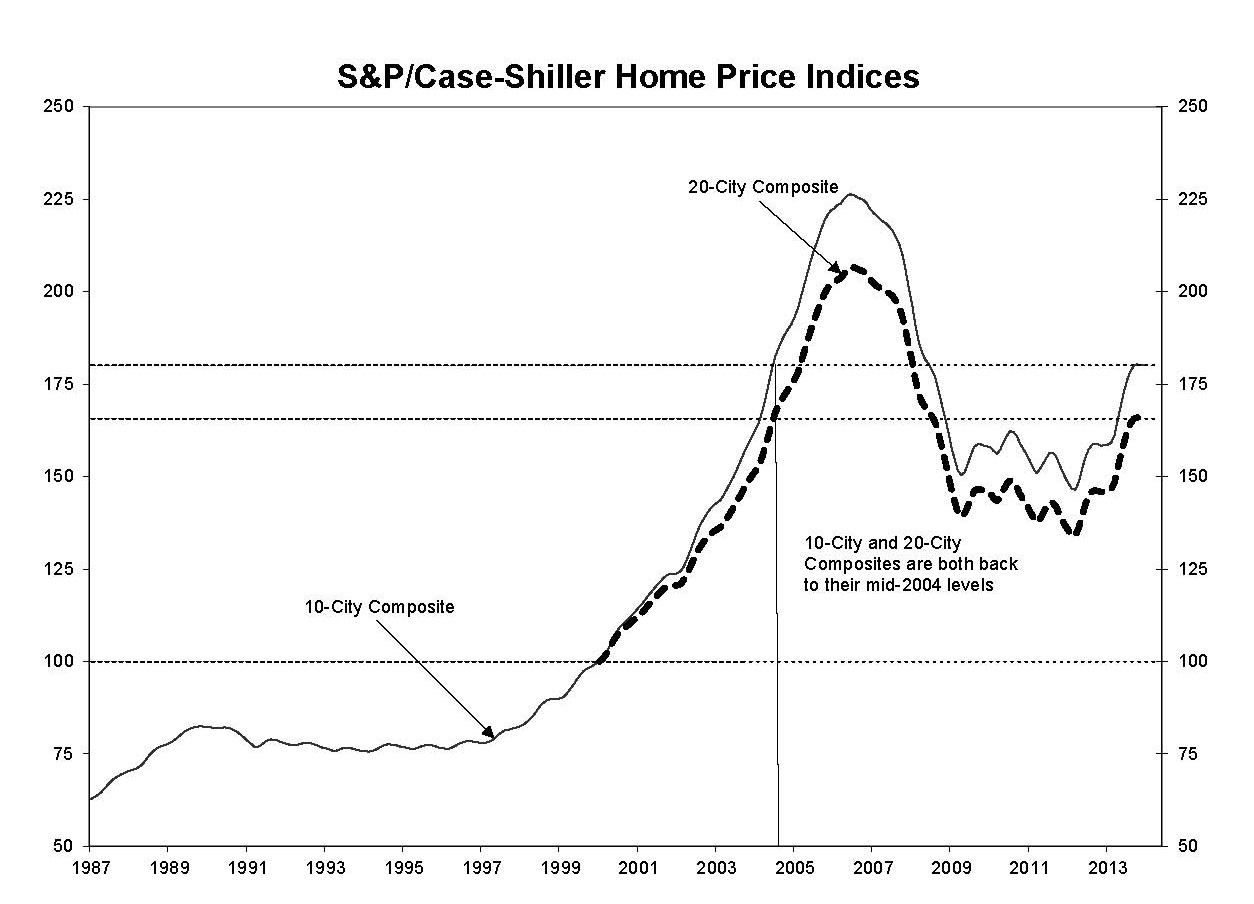
The chart above shows the index levels for the 10-City and 20-City Composite Indices. As of January 2014, average home prices across the United States are back to their mid-2004 levels. Measured from their June/July 2006 peaks, the peak-to-current decline for both Composites is approximately 20%. The recovery from the March 2012 lows is 23% for the 10-City and 20-City Composites.
Las Vegas and San Francisco remain the only two cities posting annual gains of over 20%. San Diego showed the most improvement with a year-over-year return of 19.4% in January from 18.0% in December. Phoenix saw its annual rate decelerate the most; the city’s return peaked last January when it led all 20 cities by a wide margin.
Only seven cities – Las Vegas, Miami, New York, San Diego, San Francisco, Tampa and Washington – showed positive monthly returns in January. Chicago and Seattle declined the most and posted their fourth consecutive drop in average home prices. Although Cleveland continued its decline, it showed the most improvement with -1.5% in December to -0.3% in January.
More than 27 years of history for these data series are available, and can be accessed in full by going to www.homeprice.spdji.com. Additional content on the housing market may also be found on S&P Dow Jones Indices’ housing blog: www.housingviews.com.
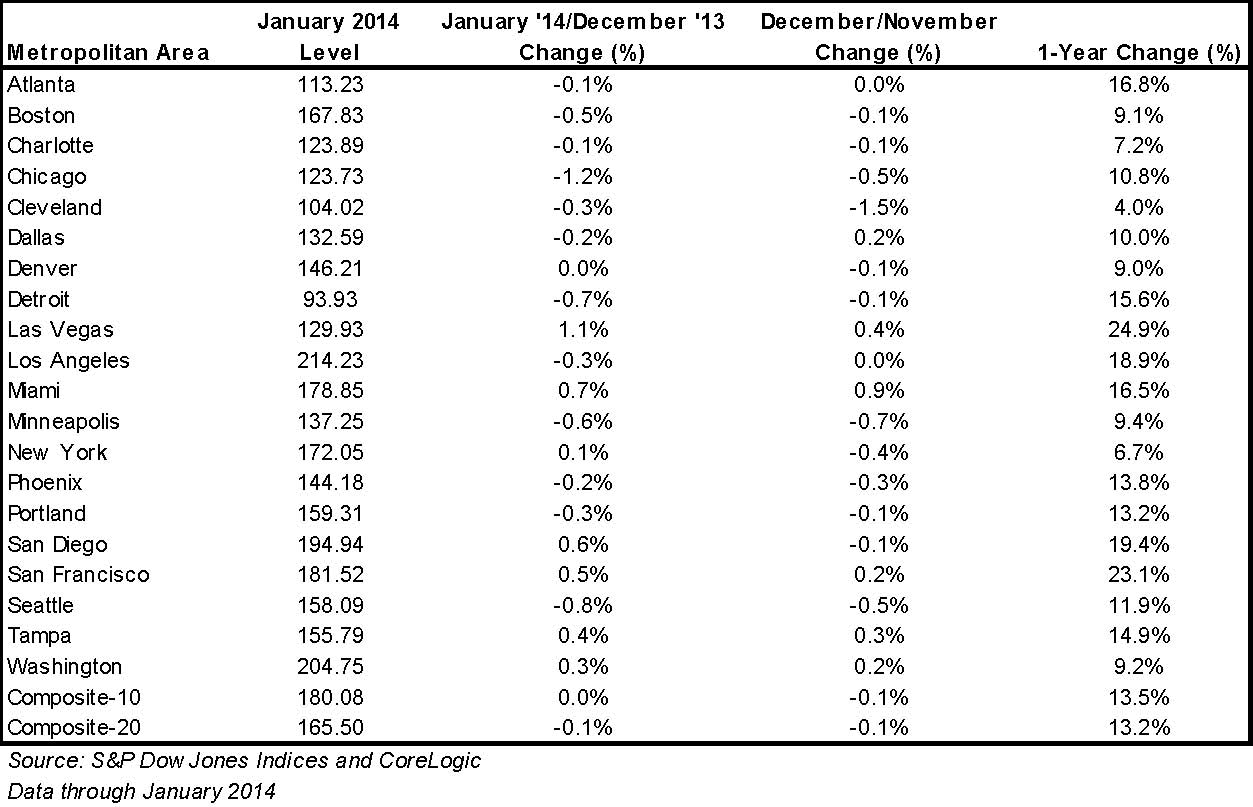
The table below summarizes the results for January 2014. The S&P/Case-Shiller Home Price Indices are revised for the 24 prior months, based on the receipt of additional source data.
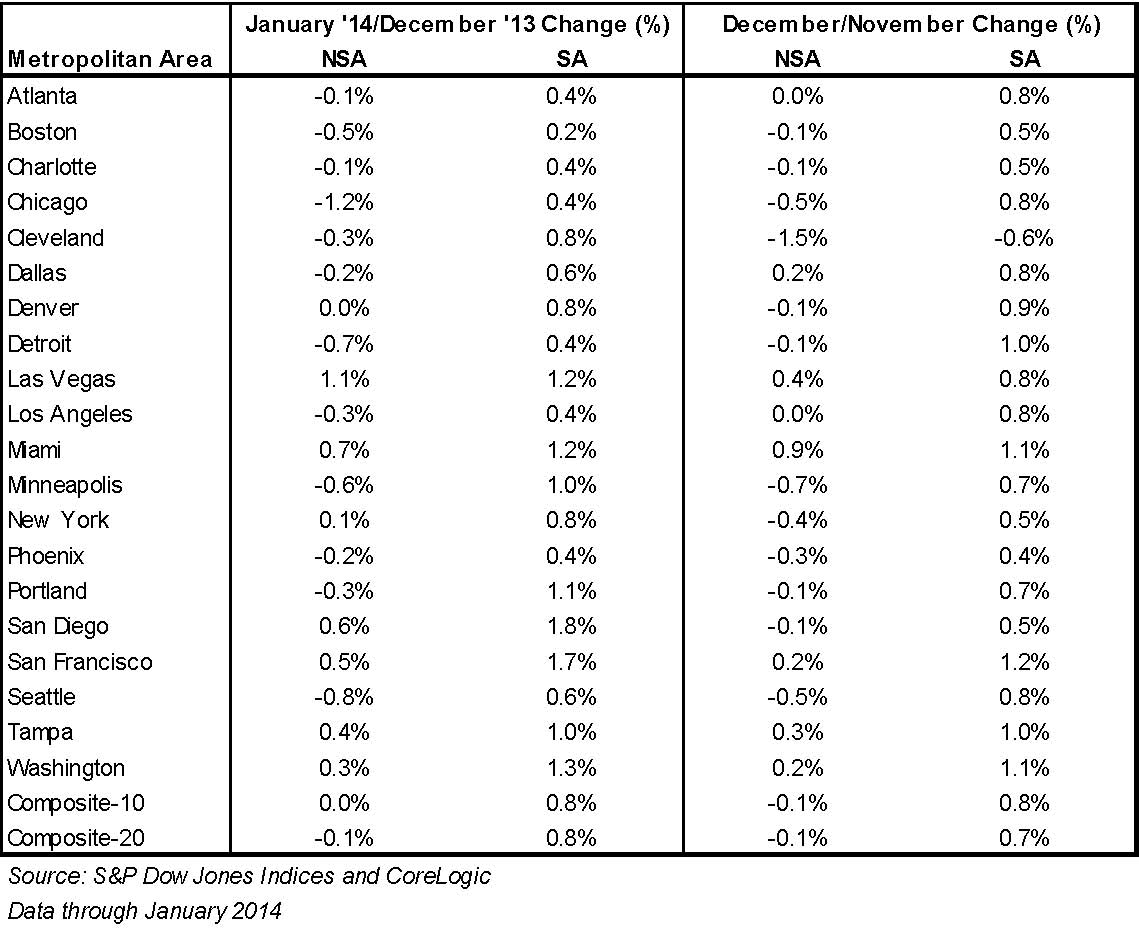
Since its launch in early 2006, the S&P/Case-Shiller Home Price Indices have published, and the markets have followed and reported on, the non-seasonally adjusted data set used in the headline indices. For analytical purposes, S&P Dow Jones Indices publishes a seasonally adjusted data set covered in the headline indices, as well as for the 17 of 20 markets with tiered price indices and the five condo markets that are tracked.
A summary of the monthly changes using the seasonally adjusted (SA) and non-seasonally adjusted (NSA) data can be found in the table below.
About S&P Dow Jones Indices
S&P Dow Jones Indices LLC, a part of McGraw Hill Financial, is the world’s largest, global resource for index-based concepts, data and research. Home to iconic financial market indicators, such as the S&P 500® and the Dow Jones Industrial Average™, S&P Dow Jones Indices LLC has over 115 years of experience constructing innovative and transparent solutions that fulfill the needs of investors. More assets are invested in products based upon our indices than any other provider in the world. With over 830,000 indices covering a wide range of asset classes across the globe, S&P Dow Jones Indices LLC defines the way investors measure and trade the markets. To learn more about our company, please visit www.spdji.com.
Standard & Poor’s and S&P are registered trademarks of Standard & Poor’s Financial Services LLC, a part of McGraw Hill Financial. Dow Jones is a registered trademark of Dow Jones Trademark Holdings LLC (“Dow Jones”). These trademarks have been licensed to S&P Dow Jones Indices LLC. It is not possible to invest directly in an index. S&P Dow Jones Indices LLC, Dow Jones, S&P and their respective affiliates (collectively “S&P Dow Jones Indices”) do not sponsor, endorse, sell, or promote any investment fund or other investment vehicle that is offered by third parties and that seeks to provide an investment return based on the performance of any index. This document does not constitute an offer of services in jurisdictions where S&P Dow Jones Indices does not have the necessary licenses. S&P Dow Jones Indices receives compensation in connection with licensing its indices to third parties.
Download the March Case Schiller Report as a .pdf


